IELTS Writing
Chiến lược làm bài writing task 1: Introduction + Overview
I. Introduction
1. Tổng quan về phần Introduction:
Chào các bạn, khi đến với cách viết mở bài cho phần IELTS writing task 1, các bạn cần biết về một số những điều cơ bản của phần này như sau:
+ Nhiệm vụ của Introduction: Nhiệm vụ của phần Introduction này là giới thiệu cho người đọc về nội dung của biểu đồ là gì: Biểu đồ cung cấp thông tin về cái gì, trong khoảng thời gian nào…
+ Chỉ cần viết duy nhất 1 câu Introduction: Introduction chỉ cần viết duy nhất một câu để diễn đạt lại đề bài theo ý riêng của mình, không dài dòng, không ý kiến cá nhân, không nhận xét, không số liệu. Với một câu này, bạn hoàn toàn dễ dàng viết Introduction trong duy nhất 2 phút vì từ vựng, cấu trúc và cách viết hoàn toàn theo khuôn mẫu và rất dễ học
+ Phần Introduction thông thường sẽ có 23-25 từ, trong đó cần nêu rõ thông tin của 5 mục sau : Subject (thể loại biểu đồ) , verb (động từ), WHAT (Biểu đồ viết về chủ đề/nội dung gì), WHERE (Biểu đồ thể hiện nội dung ở khu vực nào) và WHEN (Biểu đồ đưa thông tin trong khoảng/điểm thời gian nào)
* Note: Tips để paraphrase phần WHAT của đề bài:
Phần “WHAT” là đối tượng chính mà đề bài nhắc tới, và đây cũng là phần khó paraphrase nhất đối với học sinh.
| Cách paraphrase thường dùng | Ví dụ |
| the number of + countable noun (plural)
= how many + countable noun (plural) + verb |
The chart shows the number of young males and females playing sports in 2000
= The chart shows how many young men and women played sports in 2000. |
| the amount of + uncountable noun
= how much + uncountable noun + verb |
The chart illustrates the amount of electricity produced from three sources in 2010.
= The chart illustrates how much electricity was produced from three sources in 2010. |
| the percentage of + noun (countable or uncountable)
= the proportion of + noun (countable or uncountable) |
The chart shows the percentage of men and women participating in soccer.
= The chart illustrates the proportion of male and female participants in soccer. |
| the figure/figures for + N (countable or uncountable)
“The figure/figures for” được dùng hầu hết trong các trường hợp. Để nói về danh từ đếm được số nhiều, danh từ không đếm được hay tỉ lệ đều dùng được “figures for” |
The chart shows the number of young males and females playing sports in 2000
= The chart shows figures for young men and women playing sports in 2000. – The chart illustrates the amount of electricity produced from three sources in 2010. => The chart illustrates figures for electricity production from three sources in 2010. – The chart shows the percentage of women participating in soccer. => The chart illustrates figures for soccer participation among females. |
2. Phương pháp viết introduction hiệu quả
- Cách viết 1: Diễn đạt lại bằng từ đồng nghĩa
Đây là cách viết đơn giản, nền tảng và an toàn nhất để có được 1 câu introduction mới. Với cách viết này bạn chỉ cần thay thế những từ trong đề bài bằng những từ đồng nghĩa hoặc những cách diễn đạt mới mà bạn viết, hoàn toàn không làm thay đổi nghĩa của câu.
Đề bài: The pie charts show the main reasons for migration to and from the UK in 2007
Xác định các từ và cụm từ đồng nghĩa như sau:
- Show = illustrate, compare
- The main reason = the primary reasons, the primary causes
- Migration to and from the UK = people came to and left the UK
- In 2007 = in the year 2007
Thay thế các từ đồng nghĩa vào đúng vị trí cũ bạn có được câu mới cho phần Introduction như sau:
The pie charts illustrate the primary reasons that people came to and left the UK in the year 2007
List các từ và cụm từ dùng để paraphrase:
- graph = line graph
- chart = bar chart/ pie chart/table/flow chart
- the diagram = the figure
- the map = the diagram
- shows = illustrates (or ‘compares’ if the graph is comparing), compare…..in terms of….
- the number of = the figure for
- the proportion of = the figure for = the percentage of=the rate of
- in three countries = in the UK, France and Spain (i.e. name the countries)= in three different countries = in three countries namely….
- from 1999 to 2009 = between 1999 and 2009 = over a period of 10 years/over a 10-year period
- in 1999 = in the year 1999
- in 1980 and 2000 = over two separate years/figures are given for 1980 and 2000/in two different years
- Cách viết 2: Thay đổi cấu trúc câu
Nếu như với cách số 1, bạn hoàn toàn giữ nguyên cấu trúc câu thì với cách số hai này, bạn sẽ phải thay đổi cấu trúc câu đã cho thành 1 trong 3 cấu trúc câu sau:
a) The …chart/graph shows/illustrates/compare…….in terms of…….
Đề bài: The line graph below compares the percentage of people aged 65 and over from 1940 to 2040 in three countries
Introduction:
The line graph compares three countries, namely A, B, and C in terms of the proportion of 65-and over-year-old people between 1940 and 2040.
b) The …chart/graph shows/illustrates/compare how to + V
Đề bài: The diagram shows the process of producing cement for building purpose
Introduction:
The diagram illustrates how to produce cement from A and B for building purpose.
c) The …chart/graph shows/illustrates/compare how S + V
Đề bài: The two pie charts below show changes in world population by region between 1900 and 1909
Introduction:
The two pie charts illustrate how global population changed according to a region from 1900 to 1909
- Cách viết 3: Sử dụng mệnh đề quan hệ
Đây là cách mình thường guide cho các bạn học sinh nhất vì thức tế chúng ta chỉ cần nhớ duy nhất 1 cách đề áp dụng cho duy nhất một đề task 1 trong bài thi Writing mà thôi.
- The line graph illustrates/ gives information about/on something
- The bar chart compares something
- The table
- The pie chart
Đề bài: The graph below shows the proportion of the population aged 65 and over between 1940 and 2040 in three different countries.
Introduction:
The line graph compares the percentage of people who are 65 or more years old in the USA, Sweden and Japan from 1940 to 2040
II. Overview
Trong bài task 1, chúng ta sẽ phải viết tóm tắt chung cho thông tin trên bảng biểu. Giám khảo gọi phần này là ‘general overview’ hoặc ‘overall trend’. Đoạn văn tóm tắt phải viết ngay sau mở bài, tuy nhiên viết ở cuối bài cũng vẫn được chấp nhận. Một cách để tóm tắt bảng biểu đó là quan sát thay đổi 1 cách bao quát.
– Nhìn vào biểu đồ, tìm ra 1-2 điểm nổi bật nhất, không đưa số liệu cụ thể vào phần này
– Viết từ 1-2 câu
Mẫu câu áp dụng cho phần mô tả chung
– Overall/Generally/Briefly, it’s evident/clear/apparent/obvious that…
Ví dụ:
The graph below shows the figures for imprisonment in five countries between 1930 and 1980
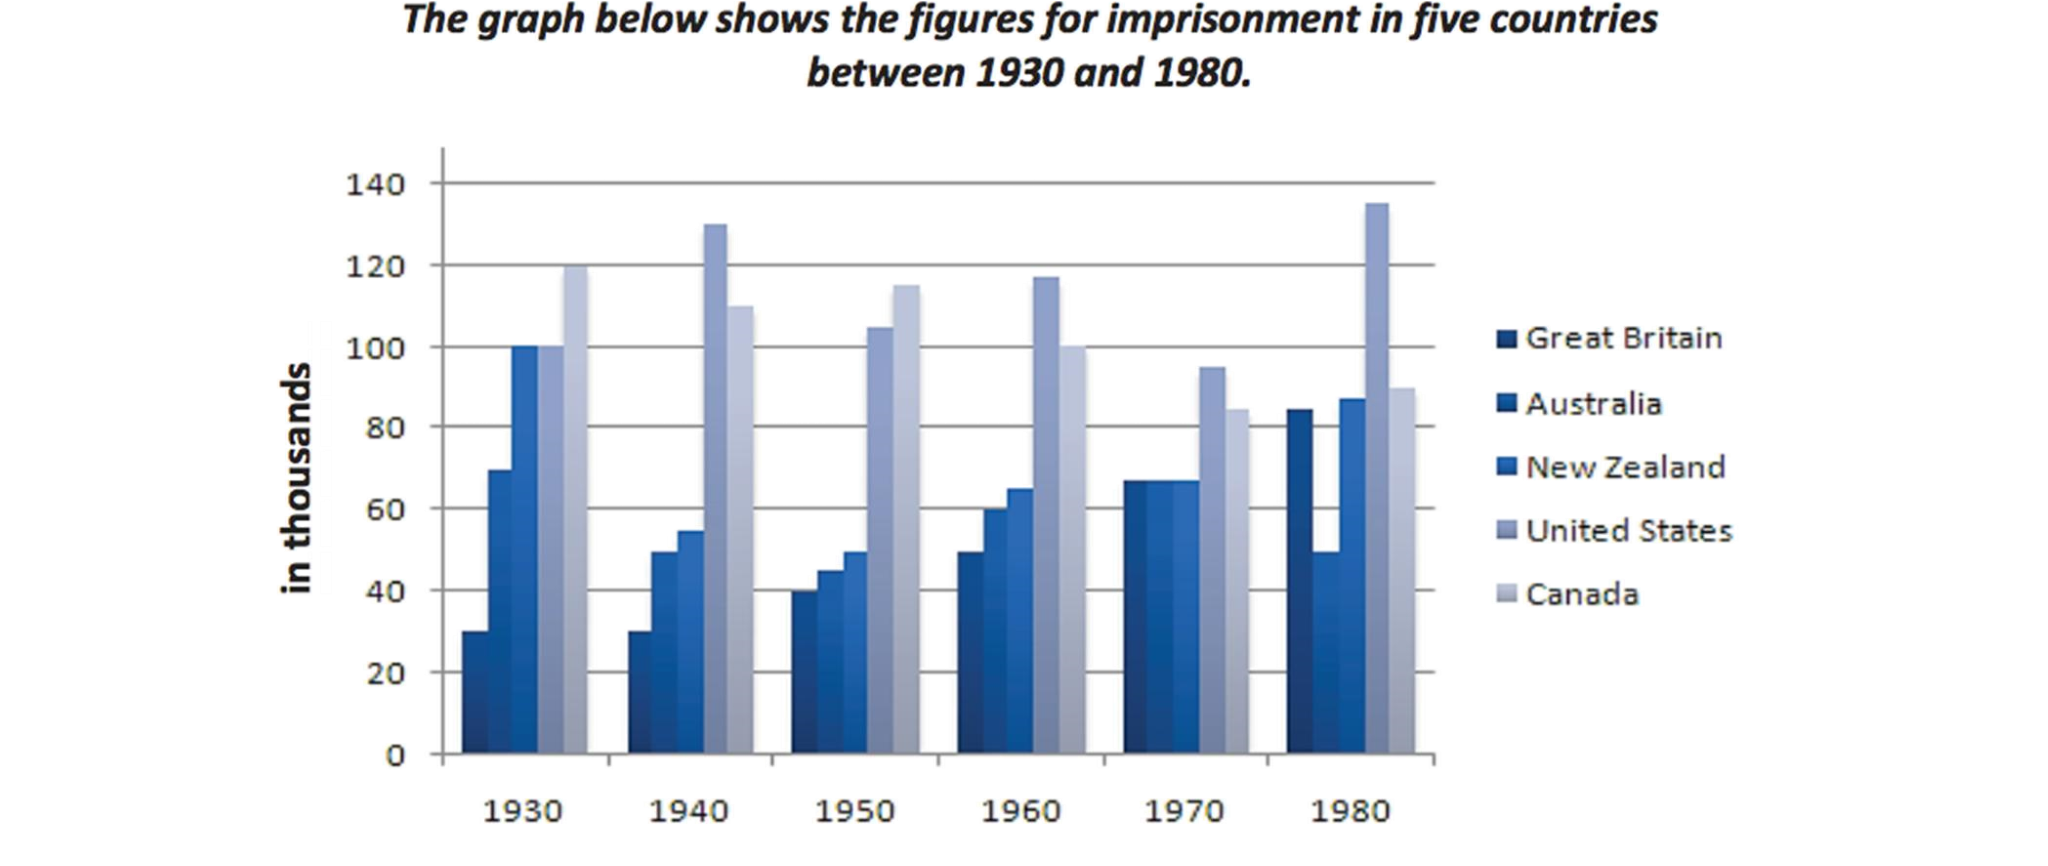
Nhận xét:
– Biểu đồ có sự thay đổi liên tục về số liệu qua các năm
– Nhìn chung, Mỹ là nước có tỉ lệ tội phạm cao nhất, Anh là nước có tỉ lệ thấp nhất
Viết tổng quan: While the figures for imprisonment fluctuated over the period shown, it is clear that the United States had the highest number of prisoners overall. Great Britain, on the other hand, had the lowest number of prisoners for the majority of the period.
!!! Chú ý:
Không dùng đại từ nhân xưng như “As you can see from the chart,…” hoặc “We can see that…”
=> Thay thế bằng: It can be clearly seen/observed/recognized that….